

Table of Content
- Dolphin Radar at a Glance
- What Dolphin Radar Tracks on Instagram
- Weekly Activity Reports
- Likes Tracking: The Standout Feature
- The Ties and Trails Panel
- AI Insights: Behavioral Profiles From Public Data
- CSV Exports and Historical Reports
- Free Tools You Can Use Without Paying
- What Dolphin Radar Cannot Track
- Feature Availability by Plan
- My Final Verdict After Six Weeks
I'll be honest about how this guide started. I signed up for Dolphin Radar expecting a basic unfollower counter, typed in one public username, paid for a plan, and mostly forgot about it. Seven days later the first report landed in my dashboard and it was far more detailed than I expected. Every like the account had left that week, grouped by who received them. New follows and unfollows. Location tags on a map. Even a guess at the account owner's personality type. I kept the subscription running for six weeks and tested it on a real Instagram account the entire time, so everything below comes from reports I actually opened, not from a marketing page.
This guide walks through every feature Dolphin Radar offers in 2026: what each one shows, which plan it sits behind, and the things the tool flat out cannot do.
Dolphin Radar at a Glance
| Tool type | Instagram activity tracker for public accounts |
| Login required | None. You never connect or enter Instagram credentials |
| Data source | Publicly visible Instagram data only |
| Report frequency | Weekly reports, with daily story and highlight updates |
| Starting price | $2.75 per month on the annual plan ($32.99 per year) |
| Accounts per plan | One public Instagram account per subscription |
| Free trial | No trial for the main service, but a sample report and free toolkit exist |
What Dolphin Radar Tracks on Instagram
The core product is called Social Insights. You give it one public username and it builds a running record of that account's visible behavior. Here is the full spread of what shows up in the dashboard.
• Likes. Which posts the account liked, who posted them, and how often the same profiles keep appearing.
• New follows. Accounts followed during the week, listed with usernames and profile links.
• Unfollows. Accounts removed from the following list, tracked report to report.
• Stories and highlights. Public stories and highlights, captured daily from the day your subscription starts.
• Tagged posts. Posts where the account was tagged by other users, a data point most rivals skip.
• Interests and activity times. Interest categories built from engagement plus the hours the account is most active.
Worth knowing: everything above relies on public data. Dolphin Radar deliberately refuses to touch private accounts or anything behind a login, which is a big part of why it has stayed on the right side of platform rules.
Weekly Activity Reports
The weekly report is the backbone of the whole service, and it shaped how I used the tool. Nothing is real time here. Data is collected continuously, then packaged into a structured report once a week, with monthly, quarterly, and annual summaries stacking on top depending on your plan.
My first report arrived about seven days after subscribing, which matches the collection window Dolphin Radar quotes for every newly added account. After that, reports appeared on schedule every week with an email ping when each one was ready.
| Report section | What you see |
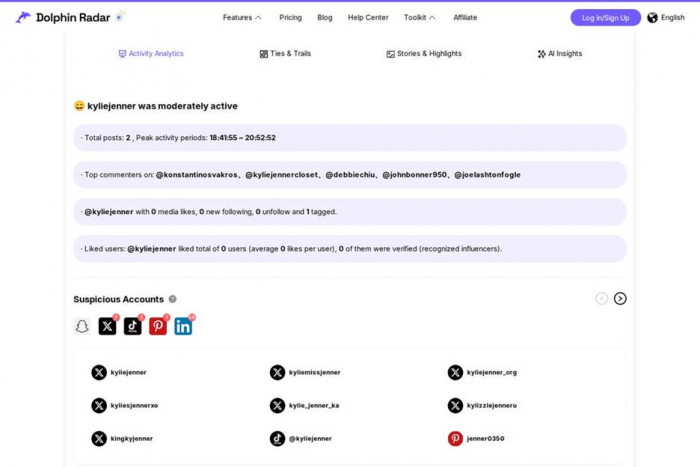
| Engagement log | Likes given during the week, with the receiving accounts ranked by frequency |
| Connection changes | Every new follow and unfollow since the last report |
| Tagged content | Public posts where other users tagged the account |
| Interest patterns | Topic categories inferred from what the account engaged with |
| Activity rhythm | The days and hours the account was most active on the platform |
One practical tip from my own use: an empty report almost always means the tracked account went private, or simply posted nothing for seven days. Give it 24 hours before assuming something broke, because the system retries collection automatically.
Likes Tracking: The Standout Feature
If you compare Instagram trackers side by side, likes tracking is where Dolphin Radar pulls ahead. Most competitors stop at follower counts. This one shows you the actual posts an account liked over time, and after a few weeks the pattern becomes the story.
In my six weeks of reports, three things stood out:
• Frequency ranking. The dashboard surfaces which creators receive the most likes from the tracked account, so repeat engagement is impossible to miss.
• Post context. Each like links back to the specific post, not just a username, so you can see exactly what earned the engagement.
• Trend direction. Because reports accumulate, you can watch interest in a profile rise or fade week over week.
For marketers, this doubles as competitor research. Watching which content a rival brand's audience engages with, week after week, tells you more than any single screenshot ever could.
Stories and Highlights, Updated Daily
Stories run on a different clock than the rest of the product. While activity reports refresh weekly, public stories and highlights are captured every day and archived to your dashboard, so a story that vanishes after 24 hours on Instagram stays viewable in Dolphin Radar.
One hard limit: story capture only begins on the day your subscription starts. Nothing posted before that date can be recovered, and the historical report feature does not reach back for stories either.
Viewing happens anonymously. The tracked account sees no view from you in its story viewer list because Dolphin Radar never interacts with the profile directly.
The Ties and Trails Panel
Ties and Trails is the cumulative layer that sits on top of the weekly reports, and it became my favorite screen by week four. Instead of isolated snapshots, it aggregates every data point collected since your start date into one dashboard. All paid subscribers get access.
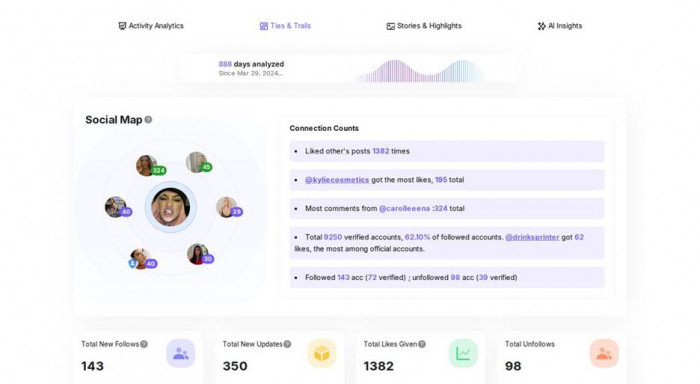
• Social Map. A visual web of the account's top interactions, showing who sits closest to the center of their engagement.
• Summary cards. Four running totals: follows, unfollows, likes, and content updates since tracking began.
• Location map. A geographic view of publicly tagged locations, sorted by country and city.
• Interest cloud. A tag cloud of themes that grows and shifts as more engagement data accumulates.
The Social Map is the piece worth paying attention to. Weekly reports tell you what happened; the map tells you who consistently matters to the account across the entire tracking period.
AI Insights: Behavioral Profiles From Public Data
AI Insights is the feature Dolphin Radar leans on hardest in its marketing, and it is restricted to quarterly and annual subscribers. The system runs collected engagement data through analysis modules and produces a behavioral profile of the tracked account. Accuracy is openly described as improving after four or more weeks of data, and that matched my experience: the first pass felt thin, the week six version felt considerably sharper.
| Module | What it analyzes | Plan |
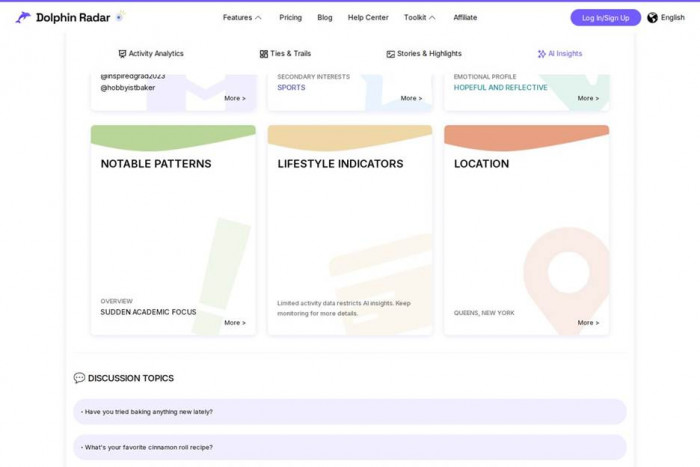
| Potential MBTI type | A personality estimate based on engagement behavior | Quarterly and up |
| Persona Snapshot | A short written profile of habits and online character | Quarterly and up |
| Lifestyle Indicators | Routines and lifestyle signals drawn from activity | Quarterly and up |
| Location | Probable areas of activity from public tags | Quarterly and up |
| Interest analysis | Deeper category breakdown of engagement topics | Annual only |
| Notable Patterns | Unusual spikes or shifts in behavior | Annual only |
| Engaged Accounts | The profiles receiving the most consistent attention | Annual only |
| Discussion Topics | Subjects appearing in public captions and comments | Annual only |
| Public Locations Mentioned | Places referenced in publicly visible content | Annual only |
My honest take: treat these as educated guesses, not facts. The MBTI module in particular is an inference from likes and follows, and Dolphin Radar itself frames it as a "potential" type. The Engaged Accounts and Notable Patterns modules are the ones grounded most directly in hard data, and they were the two I kept coming back to.
CSV Exports and Historical Reports
Two features here matter for anyone doing serious analysis rather than casual checking.
Downloadable CSV reports
From the quarterly plan upward, every report can be exported as a CSV. The export actually contains more than the dashboard shows: individual post URLs, media types, full captions, location tags, and a precise timestamp for every recorded interaction. I pulled one into Google Sheets and had a sortable engagement log in minutes, which is exactly what you want for client reporting or long term research.
Buy past reports
The historical report option lets you reach back up to 36 weeks before your subscription began. It sits under "Buy past reports" in the dashboard and is genuinely useful when you need context on how an account behaved before you started watching. Stories are the exception, since those are only captured going forward.
Cross Platform Account Detection
Annual subscribers get one extra capability the other tiers do not: a discovery feature that analyzes data to flag potentially related accounts across five platforms, including Snapchat, X, TikTok, and Pinterest. It is a pattern matching exercise rather than a guarantee, but as a starting point for finding an account's wider footprint it saves a lot of manual searching. Dolphin Radar also ships a separate Threads downloader in its toolkit, though the core product remains Instagram first.
Free Tools You Can Use Without Paying
Before spending anything, you can test a slice of the platform through the free toolkit. Every free tool carries a limit, but together they give a fair preview of the data quality.
| Free tool | What it does | Limit |
| Recent Follow Tracker | Shows accounts a public profile recently followed | Limited results shown |
| Unfollower preview | A glimpse of who unfollowed an account | Preview only |
| Comment Viewer | Reads public comments on any post | Up to 15 comments per post |
| Follower Export | Downloads a follower list | Up to 500 entries |
| Story Viewer | Watches public stories anonymously | Public accounts only |
| Extras | Hashtag generator, shadowban checker, post viewer, Threads downloader | Varies by tool |
There is also a full sample analytics report on the site. I'd look at it before buying, because the sample is consistent with the real reports and sets accurate expectations.
What Dolphin Radar Cannot Track
This section matters as much as everything above it, because most disappointment with tracking tools comes from expecting things no legitimate service can deliver.
• Private accounts. Public profiles only. This is a stated policy choice, not a paywalled feature.
• Direct messages. DMs are private data. No third party tool can read them, and this one does not try.
• Story viewers. You cannot see who watched someone else's story. That list is visible only to the story owner.
• Real time alerts. The weekly report cycle means no minute by minute notifications when activity happens.
A note on using it sensibly: the tool works entirely on data anyone could see by visiting a public profile, but it organizes that data with a persistence a manual check never has. Track competitors, your own account, or accounts you have a legitimate reason to understand, and skip anything that would feel invasive if the roles were reversed.
Feature Availability by Plan
| Feature | Monthly ($4.49) | Quarterly ($3.66/mo) | Annual ($2.75/mo) |
| Weekly activity reports | Yes | Yes | Yes |
| Daily stories and highlights | Yes | Yes | Yes |
| Ties and Trails panel | Yes | Yes | Yes |
| CSV exports | No | Yes | Yes |
| AI Insights modules | No | 4 modules | All 9 modules |
| Cross platform detection | No | No | Yes |
Every tier covers exactly one Instagram account, payments run through Stripe, and refunds are limited to specific cases within seven days of purchase, so double check the username before you subscribe. The tracked account cannot be swapped mid subscription.
My Final Verdict After Six Weeks
What impressed me
• Likes tracking with real post context, which almost no rival offers
• No Instagram login ever required, so zero risk to your own account
• Ties and Trails turns weeks of data into one readable picture
• CSV exports carry more detail than the dashboard itself
• Annual pricing at $2.75 per month is genuinely cheap for the depth
What frustrated me
• Weekly reports mean waiting, with nothing close to real time
• One account per subscription adds up fast if you track several
• No free trial for the core service, only a sample report
• AI modules like the MBTI guess should be read as speculation
• The first useful report takes a full week to arrive
Rating: 4.2 / 5. Worth it, with the right expectations
After six weeks of reports, my position is simple. If you want instant answers about one moment on Instagram, Dolphin Radar will frustrate you, because it is built around patience. If you want to understand how a public account behaves over a month or a quarter, it delivers more usable detail than anything else I've run at this price, and the likes tracking alone justifies the subscription for marketers and researchers.
The weekly rhythm changed how I used it too. I stopped checking daily and started reading reports like briefings, which is where the tool makes the most sense. For the complete testing process, including screenshots of the reports and how the data held up against manual checks, my full Dolphin Radar review with an honest verdict covers the entire experiment start to finish.