

Table of Content
- Exploring chartgpt.co
- Creating the First Chart
- Explaining Growth Over Time
- Making Comparisons Clear
- Visualizing Percentages
- Working With Larger Datasets
- Changing the Chart Style
- Improving the Chart Output
- Creating YouTube-Ready Visuals
- Exporting for Video Editing
- Checking the Data
- What chartgpt.co Does Best
- Final Verdict
Explaining numbers in a YouTube video is not always straightforward. A comparison of five products, a decade of market growth, or a breakdown of survey results can become difficult to follow when the information is presented through narration alone.
chartgpt.co provides a way to turn those numbers into visual charts without manually building them in spreadsheet software. It supports different chart styles, accepts numerical instructions in plain language, and exports graphics for use in videos.
This guide explores the chart-generation process using practical datasets, explains what different visualizations communicate, and shows how to prepare the results for YouTube.
Exploring chartgpt.co
The chartgpt.co homepage is built around a simple chart-generation interface. There is a large input field labeled "Describe the chart you want," a Generate chart button, and a preview area for the finished visualization.
Unlike spreadsheet applications, there is no need to manually select cells, insert a chart, and configure every axis separately. Users enter numerical values, describe how the information should appear, and generate the visualization.
The website supports nine chart types: bar, horizontal bar, grouped bar, stacked bar, line, area, pie, donut, and scatter. For YouTube creators, the difference between these chart styles matters because each explains a different relationship. Line charts show changes over time, horizontal bars rank categories, and donut charts communicate proportions.
Another useful feature is the option to switch chart types after generation. The tool redraws the existing data without requiring another chart generation.
The output can be exported as PNG, SVG, or PDF. The website also provides a Copy JSON option for users who need the chart specification. The interface is suitable for working with small datasets directly. For larger datasets, chartgpt.co accepts copied spreadsheet tables containing up to 500 rows.
Creating the First Chart
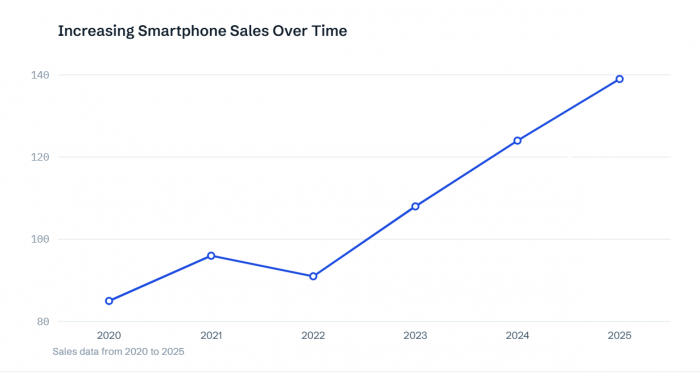
To demonstrate the process, I prepared a small dataset suitable for a technology-focused YouTube video. The topic is smartphone sales across six reporting years. The following figures are illustrative values prepared for this walkthrough rather than published industry statistics.
| Year | Smartphone sales (millions) |
| 2020 | 85 |
| 2021 | 96 |
| 2022 | 91 |
| 2023 | 108 |
| 2024 | 124 |
| 2025 | 139 |
The dataset contains a noticeable decline in 2022 followed by stronger growth in later years. That makes it useful for demonstrating how chartgpt.co handles changing numerical trends.
To create the visualization, I would enter the values into the main input field and specify a line chart showing annual smartphone sales in millions. The chart title identifies the reporting period, while the horizontal and vertical axes distinguish years from sales figures.
After selecting Generate chart, the important checks are whether the six values appear correctly and whether the years remain in chronological order.
Understanding the Visual
The sample data increases from 85 million in 2020 to 139 million in 2025, representing approximately 63.5% growth. However, sales decline from 96 million in 2021 to 91 million in 2022. A line chart preserves that detail instead of reducing the entire period to a single growth percentage. In a YouTube video, the chart can appear while the narration discusses the temporary decline and subsequent recovery.
This gives viewers a visual reference for the explanation without requiring every number to be spoken separately.
Explaining Growth Over Time
Time-based data is one of the most useful applications of chartgpt.co for educational and research-oriented YouTube content.
A video discussing company revenue, population changes, technology adoption, or economic activity often contains figures recorded across several years. A line or area chart makes the sequence easier to understand.
For the smartphone sales dataset, the line chart emphasizes changes between individual years. Switching to an area chart preserves the same data points but fills the space beneath the line.
That difference affects the presentation. The line version makes the 2022 decline easier to examine, while the area version places greater visual emphasis on the overall magnitude of sales.
For a video focused on year-to-year fluctuations, I would retain the line chart. For a broader explanation of market expansion, an area chart can provide a stronger sense of the total scale.
Neither chart changes the underlying figures. The difference is in what the viewer notices first. One limitation is that filled area charts can become crowded when several series overlap. A straightforward line chart is generally easier to read when comparing multiple trends.
Making Comparisons Clear
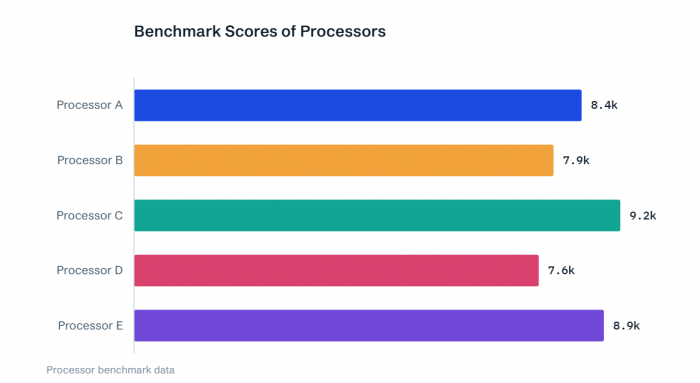
The next visualization task involves comparing categories rather than following a timeline. For a YouTube technology comparison, I prepared a second illustrative dataset containing benchmark scores for five processors.
The scores are demonstration figures, not verified results from real processors.
| Processor | Benchmark score |
| Processor A | 8,450 |
| Processor B | 7,920 |
| Processor C | 9,180 |
| Processor D | 7,640 |
| Processor E | 8,870 |
For this comparison, horizontal bars are more suitable than a line chart because the processors are independent categories. I would enter the processor names and scores into chartgpt.co, select the horizontal bar style, and arrange the values from highest to lowest.
Reading the Comparison
Processor C ranks first with 9,180 points, followed by Processor E with 8,870. Processor D records the lowest score at 7,640.
The highest score is approximately 20.2% above the lowest. This ranking becomes clear when the categories are arranged in descending order. The horizontal layout also leaves more room for processor names, which is particularly useful when a YouTube comparison includes actual product names.
For video narration, I would focus on the difference between the leading processors rather than reading the entire ranking aloud. The chart communicates relative benchmark performance, but it does not establish which processor offers the best overall experience. Battery efficiency, thermal performance, pricing, and workload differences require separate evidence.
That distinction matters whenever charts are used to support product recommendations.
Visualizing Percentages
Percentages require a different approach, especially when explaining how one total is divided among several categories. For this example, I prepared a simple audience survey involving 1,000 responses.
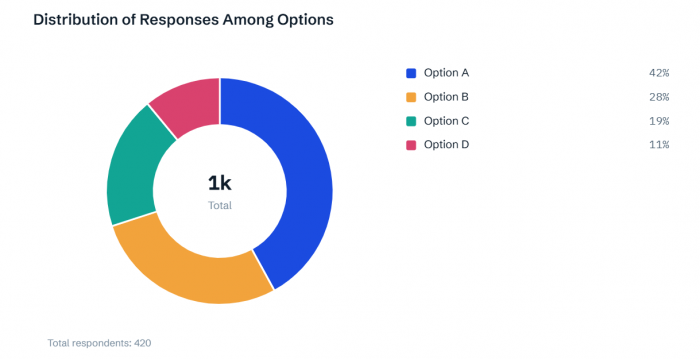
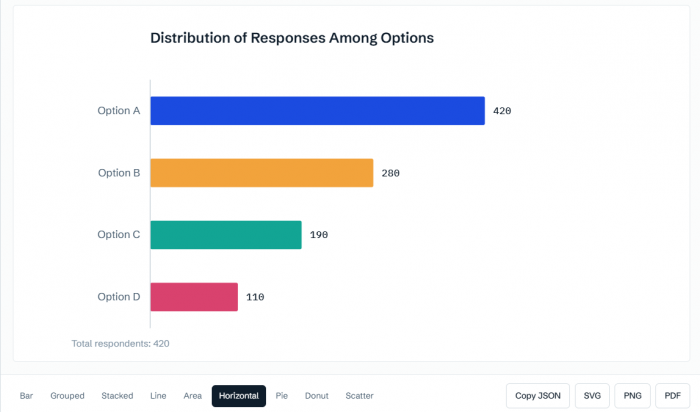
The results were divided into four categories: 420 respondents selected Option A, 280 selected Option B, 190 selected Option C, and 110 selected Option D.
Those figures represent 42%, 28%, 19%, and 11% of the total.
I would use chartgpt.co's donut chart option to display the distribution, with a readable legend identifying each category.
Understanding the Distribution
Option A represents the largest share at 42%, while Option D accounts for the smallest at 11%. The donut chart makes the proportions visible without requiring viewers to compare four separate numerical statements.
This format is useful for survey explainers, market-share breakdowns, and videos discussing the composition of a particular dataset. However, donut charts should not be used for every percentage comparison.
If the video needs to compare percentage changes across several years, a line or grouped bar chart is more appropriate. Donut charts work best when the categories form parts of one complete total.
Before generating one, I also check that the percentages add up to 100%. chartgpt.co does not automatically correct inaccurate totals, so the original data needs to be verified.
Working With Larger Datasets
Simple numerical instructions are suitable for charts containing a handful of values. More detailed YouTube research often involves spreadsheets with multiple columns or dozens of rows.
chartgpt.co supports data copied from Excel, Google Sheets, and CSV files. Tab-separated, comma-separated, and Markdown tables can be pasted into the input field.
The website's help documentation currently specifies a maximum of 500 rows per paste. For a dataset containing several years of sales figures across multiple companies, I would keep the year column and the individual company values together, with clear headings for each series.
Column labels matter because they help establish which figures belong to each axis or data series.
For a YouTube video, including every available row is rarely necessary. A chart containing 40 categories may be technically valid but difficult to understand during playback. I prefer narrowing the information to the values relevant to the video's central question.
A long product ranking can be reduced to the top five or ten results. A monthly dataset can be summarized into quarters if the video discusses broader annual performance, provided the aggregation is calculated correctly.
The objective is not to remove inconvenient data. It is to present the relevant comparison at a level the audience can understand.
Changing the Chart Style
One feature worth exploring in chartgpt.co is the ability to redraw an existing dataset using a different chart type.
The chart-type controls appear below the visualization. Switching between compatible chart styles does not consume another generation.
This is useful because the same numerical information can become more or less readable depending on its presentation. For the processor benchmark dataset, vertical bars and horizontal bars both display the five scores.
However, horizontal bars accommodate category names more naturally and make descending rankings easier to scan. The same principle applies to the smartphone sales dataset. A line chart emphasizes the changing trend, while an area chart highlights the overall volume.
Which Version Works Better?
The more useful visualization is the one that makes the intended comparison understandable with the least effort. For YouTube videos, horizontal rankings generally work well for product comparisons, while line charts are preferable for historical trends.
Changing the chart style should not change the meaning of the original figures. If a visualization makes an important decline, ranking, or difference harder to recognize, I would return to the clearer version.
This comparison is particularly useful before exporting because the chart that looks attractive in a browser may not be the easiest to read inside a video frame.
Improving the Chart Output
Generating a chart does not automatically make it ready for publication. Titles, category order, units, and the number of displayed values influence how viewers understand the result.
chartgpt.co allows these details to be specified through written instructions. For example, a title such as "Annual Smartphone Sales" identifies the topic, but "Smartphone Sales Recovered After 2022" communicates the main finding more directly.
Similarly, displaying the processor scores from highest to lowest makes the ranking easier to understand than leaving them in an arbitrary order.
The changes I would prioritize are:
● Clear measurement units: State whether values represent percentages, millions of units, dollars, or another measurement. This prevents viewers from interpreting abbreviated numbers incorrectly.
● Meaningful titles: Use headings that identify what the chart shows, including the relevant period or comparison.
● Logical category order: Keep dates chronological and rankings in descending order unless another arrangement serves the explanation.
● Limited visual information: Remove unrelated series or unnecessary categories when they distract from the video's main point.
Changing a chart's title, sorting, units, or included values requires revising the chart instructions and generating again.
The website also uses a consistent default color palette and automatically determined axis ranges. Detailed appearance controls depend on the current product plan and available features. For YouTube use, I would prioritize numerical accuracy and readability before making decorative changes.
Creating YouTube-Ready Visuals
A chart that looks clear inside a browser may become difficult to read after being placed in a video. Most conventional YouTube videos use a 16:9 frame, commonly at 1920 × 1080 pixels. The chart needs to remain legible within that layout, particularly for viewers watching on phones.
I would avoid filling a single frame with several unrelated charts. Showing one focused visualization at a time allows the narration to guide attention toward the relevant values. This also makes planning the video script easier, as each chart can support a specific explanation without overwhelming viewers with information.
For the processor comparison, the horizontal bars can occupy most of the frame while the video title or a short explanatory heading appears above them. For the smartphone sales trend, the chart can remain visible while the narration discusses the 2022 decline and subsequent increase.
The important elements are readable axis labels, clear category names, and enough contrast between the chart and its background.
chartgpt.co produces static visualizations rather than finished animated video graphics. Movement, highlighting, and transitions need to be added in the video editor. A subtle zoom toward a particular value can help focus attention, but the underlying numbers and scale must remain intact.
Exporting for Video Editing
After selecting the preferred chart style, chartgpt.co provides PNG, SVG, and PDF exports.
The best format depends on how the chart will be used.
| Format | YouTube application | Main consideration |
| PNG | Direct placement inside video editors | Use sufficient resolution for the final frame |
| SVG | Resizing or further design work | May require conversion for some editors |
| Reference documents and reports | Less convenient for direct video editing |
For ordinary editing workflows, PNG is the simplest choice. It can be imported into CapCut, Premiere Pro, DaVinci Resolve, or another editor as an image.
SVG is useful when the chart needs to be enlarged or incorporated into a more detailed composition without losing sharpness. After importing the graphic, I would place it on the video timeline and adjust its size to fit the available frame.
The chart should appear while the narration explains the corresponding data, not several seconds before or after the relevant discussion. For longer explainers containing multiple comparisons, organizing videos into chapters can also help viewers navigate directly to the statistics or comparisons they want to examine.
Another important detail is that chartgpt.co does not maintain a saved chart history. The generated chart remains in the browser tab until it is exported or the session ends. I would save each completed chart immediately and keep the exported file alongside its source dataset.
Checking the Data
Visual accuracy is particularly important for YouTube videos because viewers may accept an attractive chart without examining the original figures.
Before including a chart in a video, I would verify the numerical values, measurement units, labels, and calculations.
For the smartphone sales example, the difference between 85 million and 139 million is 54 million units. The corresponding percentage increase is approximately 63.5%.
Those two figures describe the same change differently. A chart title should not confuse an absolute increase with a percentage increase.
Another common issue is comparing figures from different time periods. Annual revenue should not be ranked against quarterly revenue without clearly identifying the difference. Bar charts also need appropriate baselines because shortening the scale can visually exaggerate relatively small differences.
chartgpt.co uses zero baselines for bars by default, helping keep bar lengths proportional to the represented values.
Finally, a visualization can reveal a relationship without proving its cause. Increasing sales and advertising spending during the same period does not establish that advertising caused the increase. For research-based videos, the original data source should also be identified so viewers can distinguish verified statistics from illustrative examples.
What chartgpt.co Does Best
chartgpt.co is most useful when the numbers are already available and the remaining task is turning them into a readable chart.
Its main strengths are straightforward numerical input, nine visualization styles, quick chart-type switching, and export options suitable for presentation and video production.
The website is not a complete video creation platform. It does not add animation, edit footage, produce narration, or automatically synchronize charts with external data. There is also no saved chart history, so users need to manage their exported files.
Pricing
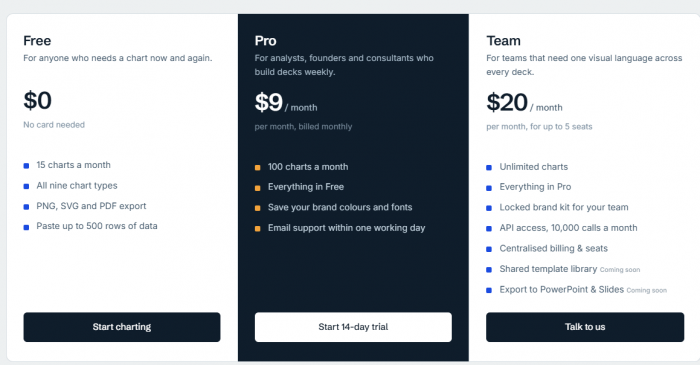
According to the current chartgpt.co pricing page:
● Free: $0, with 15 chart generations per calendar month, all nine chart types, and PNG, SVG, and PDF exports.
● Pro: $9 per month, with 100 chart generations and additional brand customization features.
● Team: $20 per month for up to five seats, with unlimited chart generations, team branding features, and API access.
The Free plan is sufficient for occasional charts, while higher-volume creators can consider the paid plans. Pricing and available features should be checked before subscribing.
Final Verdict
chartgpt.co offers a practical way to turn numerical information into visualizations for YouTube videos. Line and area charts explain trends, horizontal bars communicate rankings, grouped charts support comparisons, and donut charts display proportions.
The most useful feature is not simply the number of chart types. It is the ability to take prepared figures, describe the intended comparison, and produce a visual without manually configuring a spreadsheet chart.
There are limitations, particularly around animation, direct data connections, and saved chart history. However, for YouTube creators explaining statistics, technology comparisons, financial information, or research findings, chartgpt.co provides a focused chart-generation tool that fits naturally into the video production process.